Politics in two-dimensional charts with Nolan and Pournelle
Ritankar is a geopolitics and IR enthusiast. Has a keen eye on sports and tries to keep himself updated. He is currently pursuing his grads from the University of Calcutta with a major in Political Science.
A political compass or a political map are two similar words that are used to refer to the political spectrum especially to classify the different political positions categorically. The oldest way from where the inclusion of the left-right dimension originated was how the French parliament’s seating was arranged after the revolution of 1789. The radicals who took the left were replaced by communism and socialism later on in regards to international recognition. Whereas the aristocrats on the right were replaced by the conservatives and reactionists similarly.
As political scientists have been vocal about a single left-right axis being insufficient and inadequate in updating its timely variations, any idea that rejected the conventional left-right axis (for e.g. Centrism) has often been labelled as syncretic.
Jerry Pournelle’s famous political chart has economic freedom on one axis and social freedom on the other axis that the libertarians like to share to show that they’re the only group who genuinely respect freedom, neglecting all the other options. In terms of Pournelle’s chart that dates back to 1963 actually had on one axis ‘reliance on the state’ and on the other ‘rationality vs irrationality and that’s a very interesting way of dividing up the problem.


Jerry Pournelle came up with this model in 1963 and wrote this in his Political science PhD dissertation on a proof that the political spectrum has more than one dimension, and the old left-right view wasn’t really convincing anymore.
Though in any chart of left-right dimensions generally the socialists are put on one end, and libertarians on the other. This chart also separates communists who are hyper-rational at least on the surface, endlessly chopping logic, hair-splitting and getting into vast doctrinal juggernauts with paramount and ultimate consequences drawing from Nazis and fascists who are far more mystical. On the other hand, it has a bit of a tendency to lump conservatives and fascists together which might be taken into account as a mistake. But in the lower right-hand quadrant of the chart, professor Pournelle has placed conservatives and fascists under the tags of irrationality and enormous state control. Even those can’t be completely denied as well.
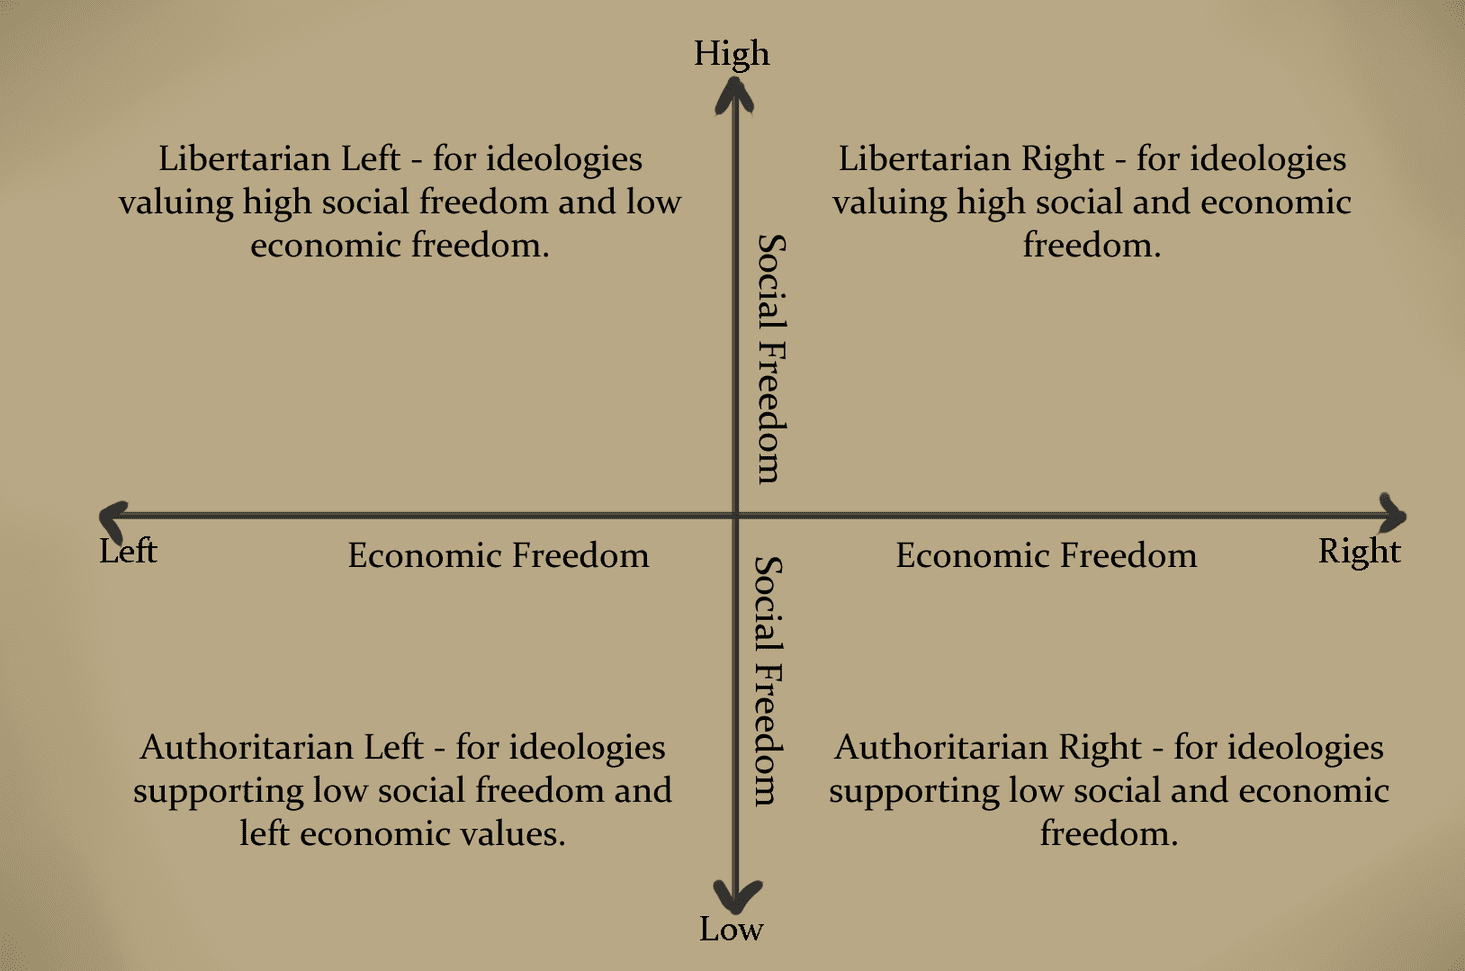
If we take to the Libertarians chart or the Nolan Chart, the attitude towards economic freedom from those regarding social freedoms get separated. A curious tendency of the liberals also is functional here. They look forward to high personal freedom, whereas the amount of economic freedom remains minimum. If somebody of a very young age opts for acting in pornographic content as he or she receives a minimum wage as payment, the conservative tendency of thinking will be that such a kind of film is a bad idea. The socialists will come up with an idea a little supportively saying that he or she won’t starve, with that he/she would have economic as well as social freedom. The populists on the other hand often take such a similar view though the libertarians favour both.

It was published in an article named “Classifying and Analyzing Politico-Economic Systems” in the first month of 1971 in (The Individualist) the monthly magazine of Society for Individual Liberty (SIL) which later on that year went on to become the Libertarian Party of the United States of America.
The American political theorist Brian Patrick Mitchell points out and criticizes the Nolan chart wherein the bottom right stresses high economic freedom with quite a significant amount of interference on personal freedom. This view of acceptance exercised by the Right, of state intervention on personal freedom and its rejection by the Left, doesn’t define the dimensions’ positions amply and tend to be false.
The Nolan chart diagram appeared for the first time in 1969, which is nearly 7 years after the creation of the Pournelle chart. Though, both the charts try to perform a similar function but their structures differ in several aspects. It’s like a political compass with a two-dimensional graph, and the axis of Jerry Pournelle’s design are different from the other systems.
The initial claim of political positions being located on a chart with two geometric axes was made by the British psychologist Hans Eysenck in his book published in 1954.(1) Though he reached his conclusions with the help of statistical evidence and surveys, it led to a set of liquid classification of political positions into four quadrants. More details are laid and can be identified if the positioning is based within an exact quadrant. His book was named Psychology of Politics, which inspired more theorists and another work The Floodgates of Anarchy by a Scottish anarchist writer and an English anarcho-communist writer appeared in 1970. In their charts, they differentiated collectivism–capitalism, on one hand, individualism–totalitarianism on the other, with anarchism, fascism, “state communism” and “capitalist individualism” in the corners.
So, more bi-dimensions and political spectrums appeared like this. As David Nolan became frustrated with so many variations following only a single kind of left-right analysis he planned a chart with two axes which advocated the real defining factor that is how an individual himself or herself thinks about the amount of government control over human action.

Reaction to the Representational flaws
This kind of displays of a two-dimensional coordinate system has a lot of inherent representational flaws. The most important of all being the invisibility of the effect of time constraints and up-gradation or advancements of the system that are expected to appear with time. A professor who identifies himself as just a public-policy commentator came up with an addition to the Pournelle chart. According to him if we would have had a third axis on that chart, where we would be having our economic and social freedom accompanied by ‘lawful and lawlessness’ then the numerous anarchists those who are very much alike libertarians with grown fangs and hair could have been addressed. Moreover, a fascist is very much like a socialist who’ll eventually start growing fangs and hair. They want to control our lives, but they’re also willing to manipulate us, they’re willing to violate election laws, they’re also willing to pave way for dictatorship for life and enjoy incumbency forever if possible. We have our authoritarians who have many values that conservatives find congenial but essentially believe in strongman rule and deny their oppositions equal protection of the law or indeed any protection of the law.
So, the Pournelle chart has got the issue of rationality versus irrationality. By the term irrationality, we bend off into the lawlessness of the Nazis and anarchists, those who don’t understand reasoning. This can be taken care of if we can cultivate faith in our intellectual capacity through exercise to fix reality from idiotic mistakes which have filled history time and again. So other than economic freedom and social freedom, another axis called lawful and lawlessness in today’s world seems to be important and added.
The hindrances, classification has proposed the visible spectrum has contributed to an unjust dichotomy of the two ends. This is because, when communism gets addressed at one end, fascism makes way on the other. Both the ends act independent and exclusive in their zones wrt the spectrum. The mutual independence though may thrive but doesn’t fulfil the general mutual understanding of exclusivity. When political theories of social fascism or developments resulting from communism as well as fascism hand in hand aren’t out of fashion, it proves that there are more possibilities that the chart hasn’t touched upon. And as coalescence is possible, their exclusive independence within the chart doesn’t necessarily mean to have addressed all the possibilities.
The terms ‘left’ or ‘right’ have collected emotional weight through the education or growing up process of an individual. So, taking a stand by completely going neutral in a robotic sense or unlearning personal experiences is impossible. The degree of evolution of the cracks and fissures within such constricted political mapping has grown more rather than any up-gradation that either of the two charts could have incorporated with time.
References
- Lewis. J. Gary, (2016), Hans Eysenck and the First Wave of Socio-Political Genetics, Department of Psychology, Royal Holloway, University of London, Egham, Surrey TW20 0EX, United Kingdom
Image Credits: The Hindu