Multidimensional lens on poverty measurement
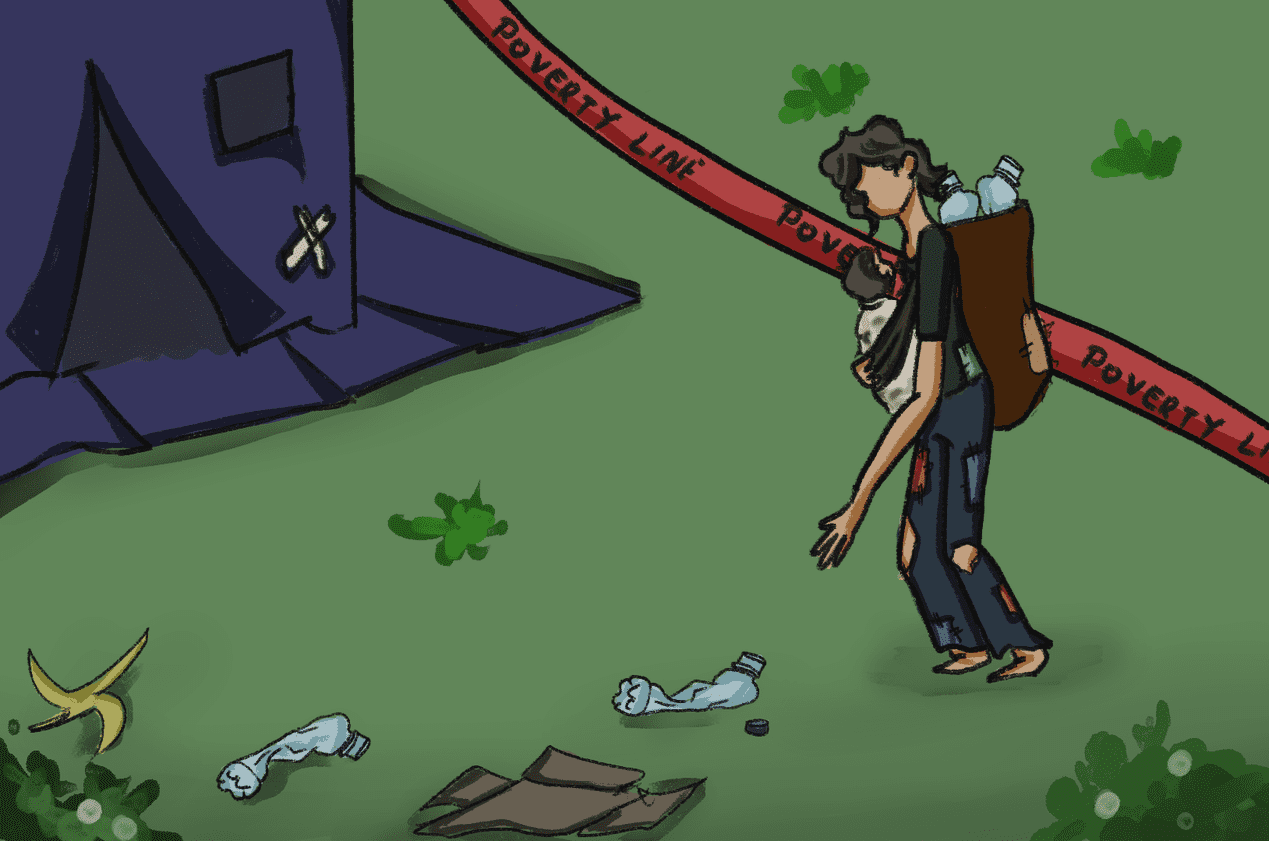
The international poverty line (IPL) 2022 of $2.15 per day is the most widely used measure of poverty. It is used by international agencies, donors, and many NGOs and microfinance institutions to ensure that their programs reach people living below the poverty line. Even at the national level, countries recommend a poverty line, as seen in India, where citizens living under a monthly per capita consumption expenditure of Rs. 1,059.42 in rural areas and Rs. 1,286 in urban areas constitute the Below Poverty Line population. The economic threshold for each state in India further varies from the national average.
Unfortunately, determining whether a family actually lives on less than $2.15 per person per day can be laborious — it is not as uncomplicated as asking how much they make. To begin, the IPL is not measured in dollars or rupees, but in enigmatic economic units known as ‘Purchasing Power Parity’ (PPP). PPP accounts for exchange rates and currency differences. Considering the fact that many families themselves practice the art and science of agriculture and have several informal loans running concurrently, the accuracy of the international monetary standard for identifying poverty-stricken individuals is questionable.
Progress Out of Poverty Index®
The Grameen Foundation developed a different approach called the Progress out of Poverty Index® (PPI®) to address precisely this issue which uses ten simple questions to assess interventions for eradicating poverty and determine the likelihood that a particular household is living below the national poverty line such as ‘Does your household own a water pump?’ and ‘How many of your children are enrolled in school?’. It covers a list of social indicators including illiteracy rate, scarcity of economic opportunities, inadequate access to healthcare and sanitation, and poor housing facilities, which by no means is exhaustive.
This statistical tool has already been customized for approximately 45 countries by analyzing hundreds of questions from national household surveys to determine which were most strongly related to poverty. The top ten most powerful questions were selected using a combination of statistical analysis and expert judgment.
The PPI® tool is a good choice when organizations and businesses want to:
- know how many of their program participants are poor
- choose program participants based on whether or not they are poor
- track changes in poverty over time
- tailor parts of the program or service to an individual’s level of poverty
- collect data with field staff rather than professional data collectors
- assess data in a limited time
- analyze data with bounded statistical knowledge
The PPI® tool is not a good choice for microfinance practitioners when they are
- measuring very small changes in poverty or living conditions for individual households
- conducting quantitative research and intend to use the findings in complex bivariate or multivariate statistical analyses
- using another official tool based on national or donor requirements
- serviced by unlettered data collection staff
World Bank’s Multidimensional Poverty Measure: A New Perspective
Looking at poverty through the World Bank’s lens, we can understand poverty beyond monetary deprivation or income deficit using its Multidimensional Poverty Measure (MPM) by including access to education and basic infrastructure alongside the monetary headcount ratio at the $2.15 IPL. According to the Poverty and Shared Prosperity 2020 report (World Bank, 2020), the monetary headcount ratio does not encapsulate more than one-third of those experiencing multidimensional poverty, which is consistent with previous editions of the report (World Bank, 2018).
When education and basic infrastructure are added to monetary poverty, the global share of the poor rises by 50%, from 11.5 percent to 17.5 percent deprived in at least one of the three dimensions. Almost a third of the multidimensionally poor are impoverished in all three dimensions at the same time. These figures do not yet fully account for COVID-19’s impact on the world’s poor. The April 2022 update (World Bank, 2022) presents the third edition of the MPM, based on updates to the Global Monitoring Database (GMD). Some changes reflect the availability of more recent survey data. Other changes are the addition of new economies to the dataset, the release of new population data, and new monetary poverty estimates.
Inspired by the recommendations of the Atkinson Commission on Global Poverty, the international financial institution in its 2018 edition of the Poverty and Shared Prosperity Report added new ways of assessing poverty to get a more complete picture that complements what we learn from the IPL by recognizing three fundamental shifts in the nature of poverty itself: one, most of the world has become better off; two, there are other essential deprivations besides not having money that can make someone poor; and three, poverty may fall more heavily on some members of a household than others.
Poverty is a relative concept
The World Bank’s Poverty and Shared Prosperity Report, 2018 introduced two new sets of monetary poverty lines to supplement the 2011 $1.90 IPL. The first set is higher poverty lines, which are set at $3.20 and $5.50 per day (in 2011 PPP dollars), respectively, to reflect typical national poverty thresholds in middle-income countries. Although 10% of the world’s population lived on less than $1.90 per day, a quarter of the world lived on less than $3.20, and nearly half of the world lived on less than $5.50 per person per day.
Furthermore, rather than being fixed in value, the report introduced a societal poverty line that increases in value as a country becomes richer (as measured by increases in median consumption or income levels). This poverty line is based on the average value of national poverty thresholds and varies by country’s level of well-being and incorporates both absolute extreme poverty and the more relative notion of ensuring that the less well-off in each society benefit as that society grows.
Poverty is defined by factors other than income
The report previewed a new MPM that goes beyond consumption or income poverty by incorporating non-monetary dimensions. Education, health, electricity, water, sanitation, and physical and environmental security are all essential for happiness. Because many of these items cannot be purchased, they are typically excluded from the definition of extreme poverty. This work builds on the tradition established by the United Nations Development Programme and the Oxford Poverty and Human Development Initiative with the Global Multidimensional Poverty Index and complements it by incorporating monetary and non-monetary dimensions of well-being. This contributes to a better understanding of the interactions between the various domains of poverty.
The Poverty and Shared Prosperity report, published in 2013, combines consumption poverty with education and access to basic infrastructure in 119 countries. When these two dimensions are added to monetary poverty, the global share of the poor increases by 50%
Poverty differs by household
Finally, most countries measure poverty at the household level, assuming that everyone in a poor household is poor. However, because there is inequality within households, there are likely to be poor people living in non-poor households and non-poor people living in poor households. In most countries, current data and methods do not allow for accounting for inequality within households, but the report examined selected country studies where this is possible and described how this affects the global profile of poverty.
The evidence suggests that poverty affects women and children disproportionately, though this varies greatly across countries and household types. During the reproductive years, when care and domestic responsibilities overlap and conflict with productive activities, gender differences in poverty are greatest.
When combined, these new poverty lines, tools, and measures provide a more complete picture of poverty. The more comprehensive depiction reinforces the positive story of significant progress in reducing extreme poverty. However, the new methodologies also reveal previously unknown details about the nature and extent of poverty around the world. The new approaches to understanding poverty enable us to better monitor poverty in all countries, across all aspects of life, and for all individuals in every household.
As extreme poverty becomes more entrenched in a few countries and the rate of reduction slows, ending extreme poverty will necessitate a redoubling of efforts and a greater focus on the worst-affected countries. However, in order to truly end poverty, we must now think more broadly and recognize the non-monetary facets and greater complexity of poverty around the world.
Fiscal responsibility will be required to ensure that funding is available to protect the most vulnerable. While there will always be some subjectivity in measuring poverty, policymakers should strive to consider changes to how poverty is measured as programs’ poverty guidelines are critical for reducing income inequality and creating a more robust economy.
References
- World Bank. (2022). Poverty and Shared Prosperity 2022: Correcting Course. Retrieved from https://www.worldbank.org/en/publication/poverty-and-shared-prosperity
- World Bank. (2020). Poverty and Shared Prosperity 2020: Reversals of Fortune. Retrieved from https://www.worldbank.org/en/publication/poverty-and-shared-prosperity-2020
- World Bank. (2018). Poverty and Shared Prosperity 2018: Piecing Together the Poverty Puzzle. Retrieved from https://www.worldbank.org/en/publication/poverty-and-shared-prosperity-2018
